Linhao Meng
Hi! My name is Linhao Meng. I am currently a final year Ph.D. student in Computer Science at Eindhoven Univeristy of Technology advised by Prof. Anna Vilanova and Dr. van den Elzen. My research focuses on designing visualizations and creating interactive tools to enhance human’s ability to understand data and models in machine learning tasks.
I believe in the power of visualization to unveil latent patterns within data and facilitate communication between human and data.
Featured Publications
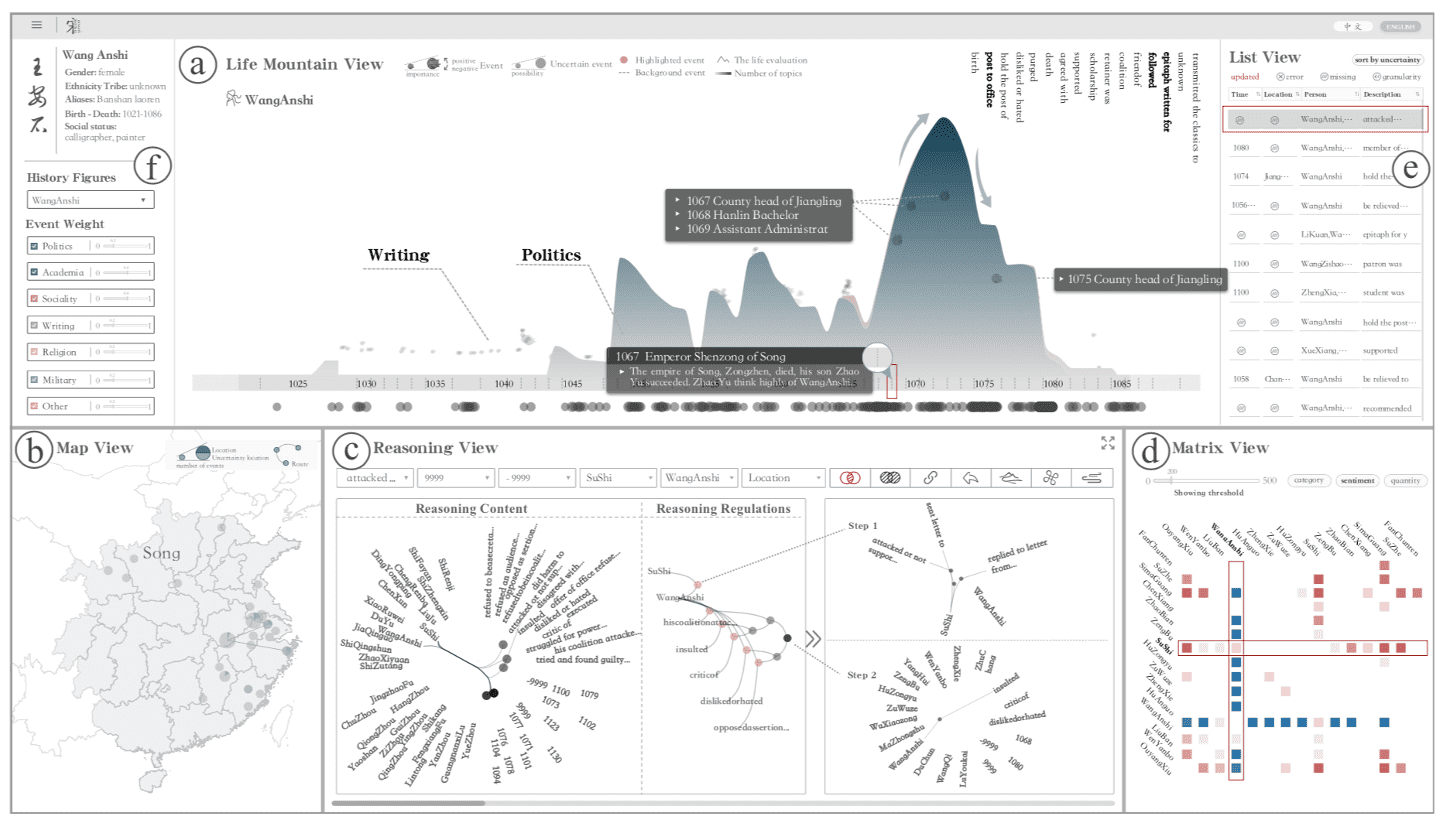
Visual Reasoning for Uncertainty in Spatio-Temporal Events of
Historical Figures
IEEE Transactions on Visualization and Computer Graphics 2022
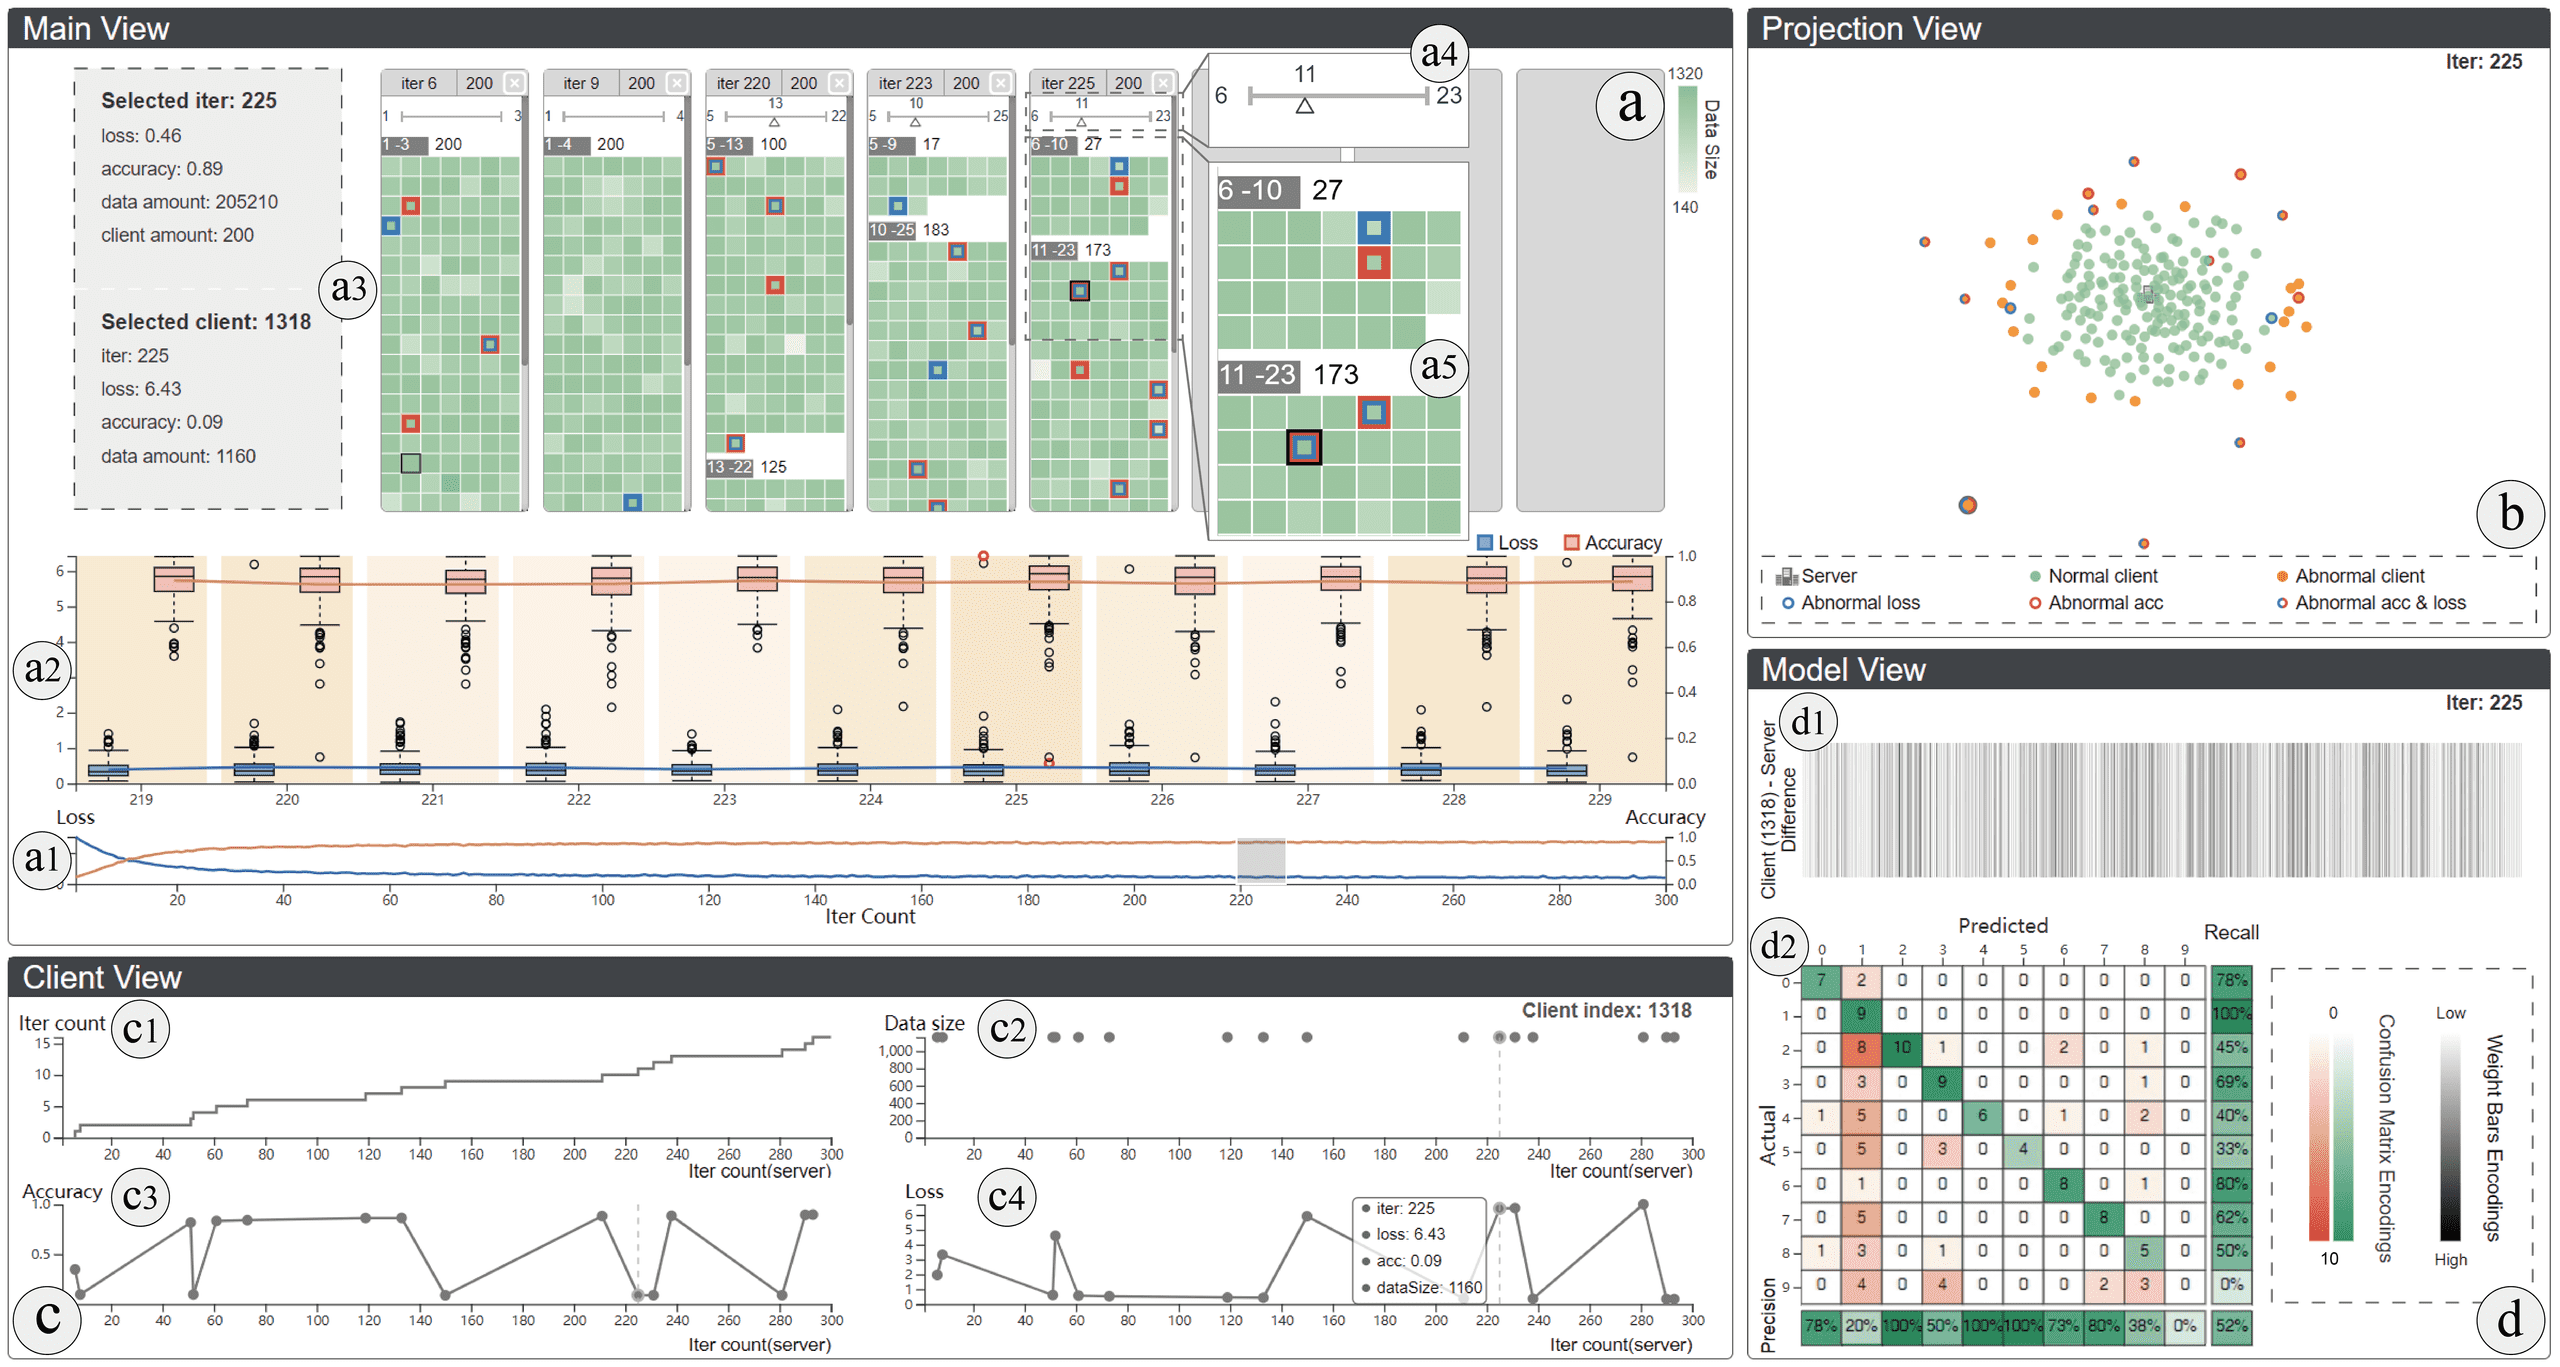
VADAF: Visualization for Abnormal Client Detection and Analysis in
Federated Learning
ACM Transactions on Interactive Intelligent Systems 2021
Visualization Projects
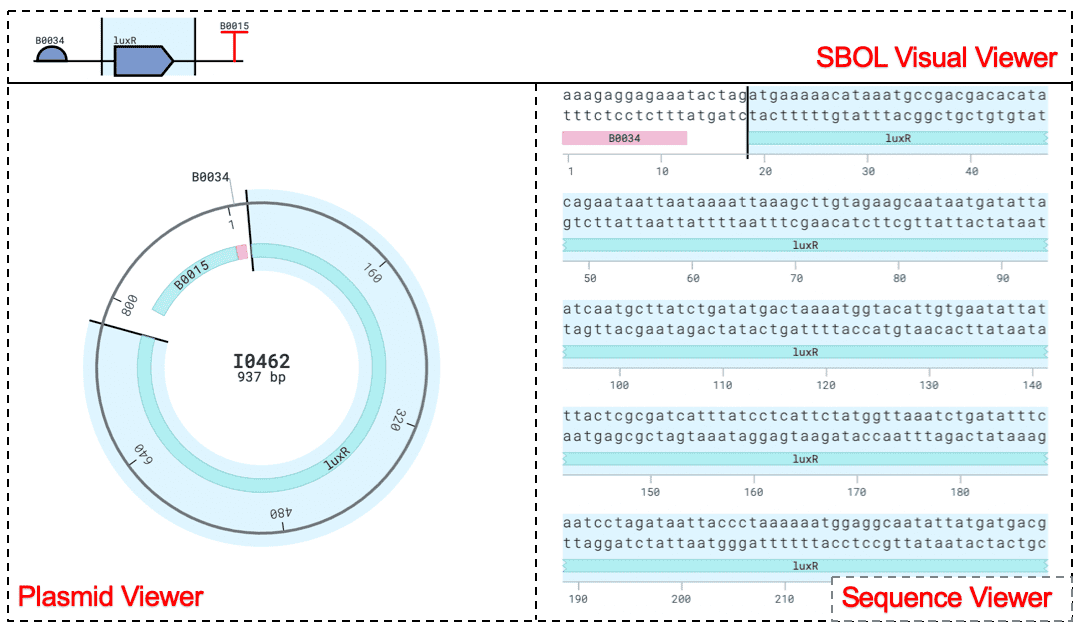
Sequence View Plugin
Sequence View Plugin is a visualization plugin engine for SynBioHub
to enhance the functional annotations of DNA sequence which are
coordinated with the SBOL Visual standard. This project is done
under NRNB in Google Summer of Code Program.
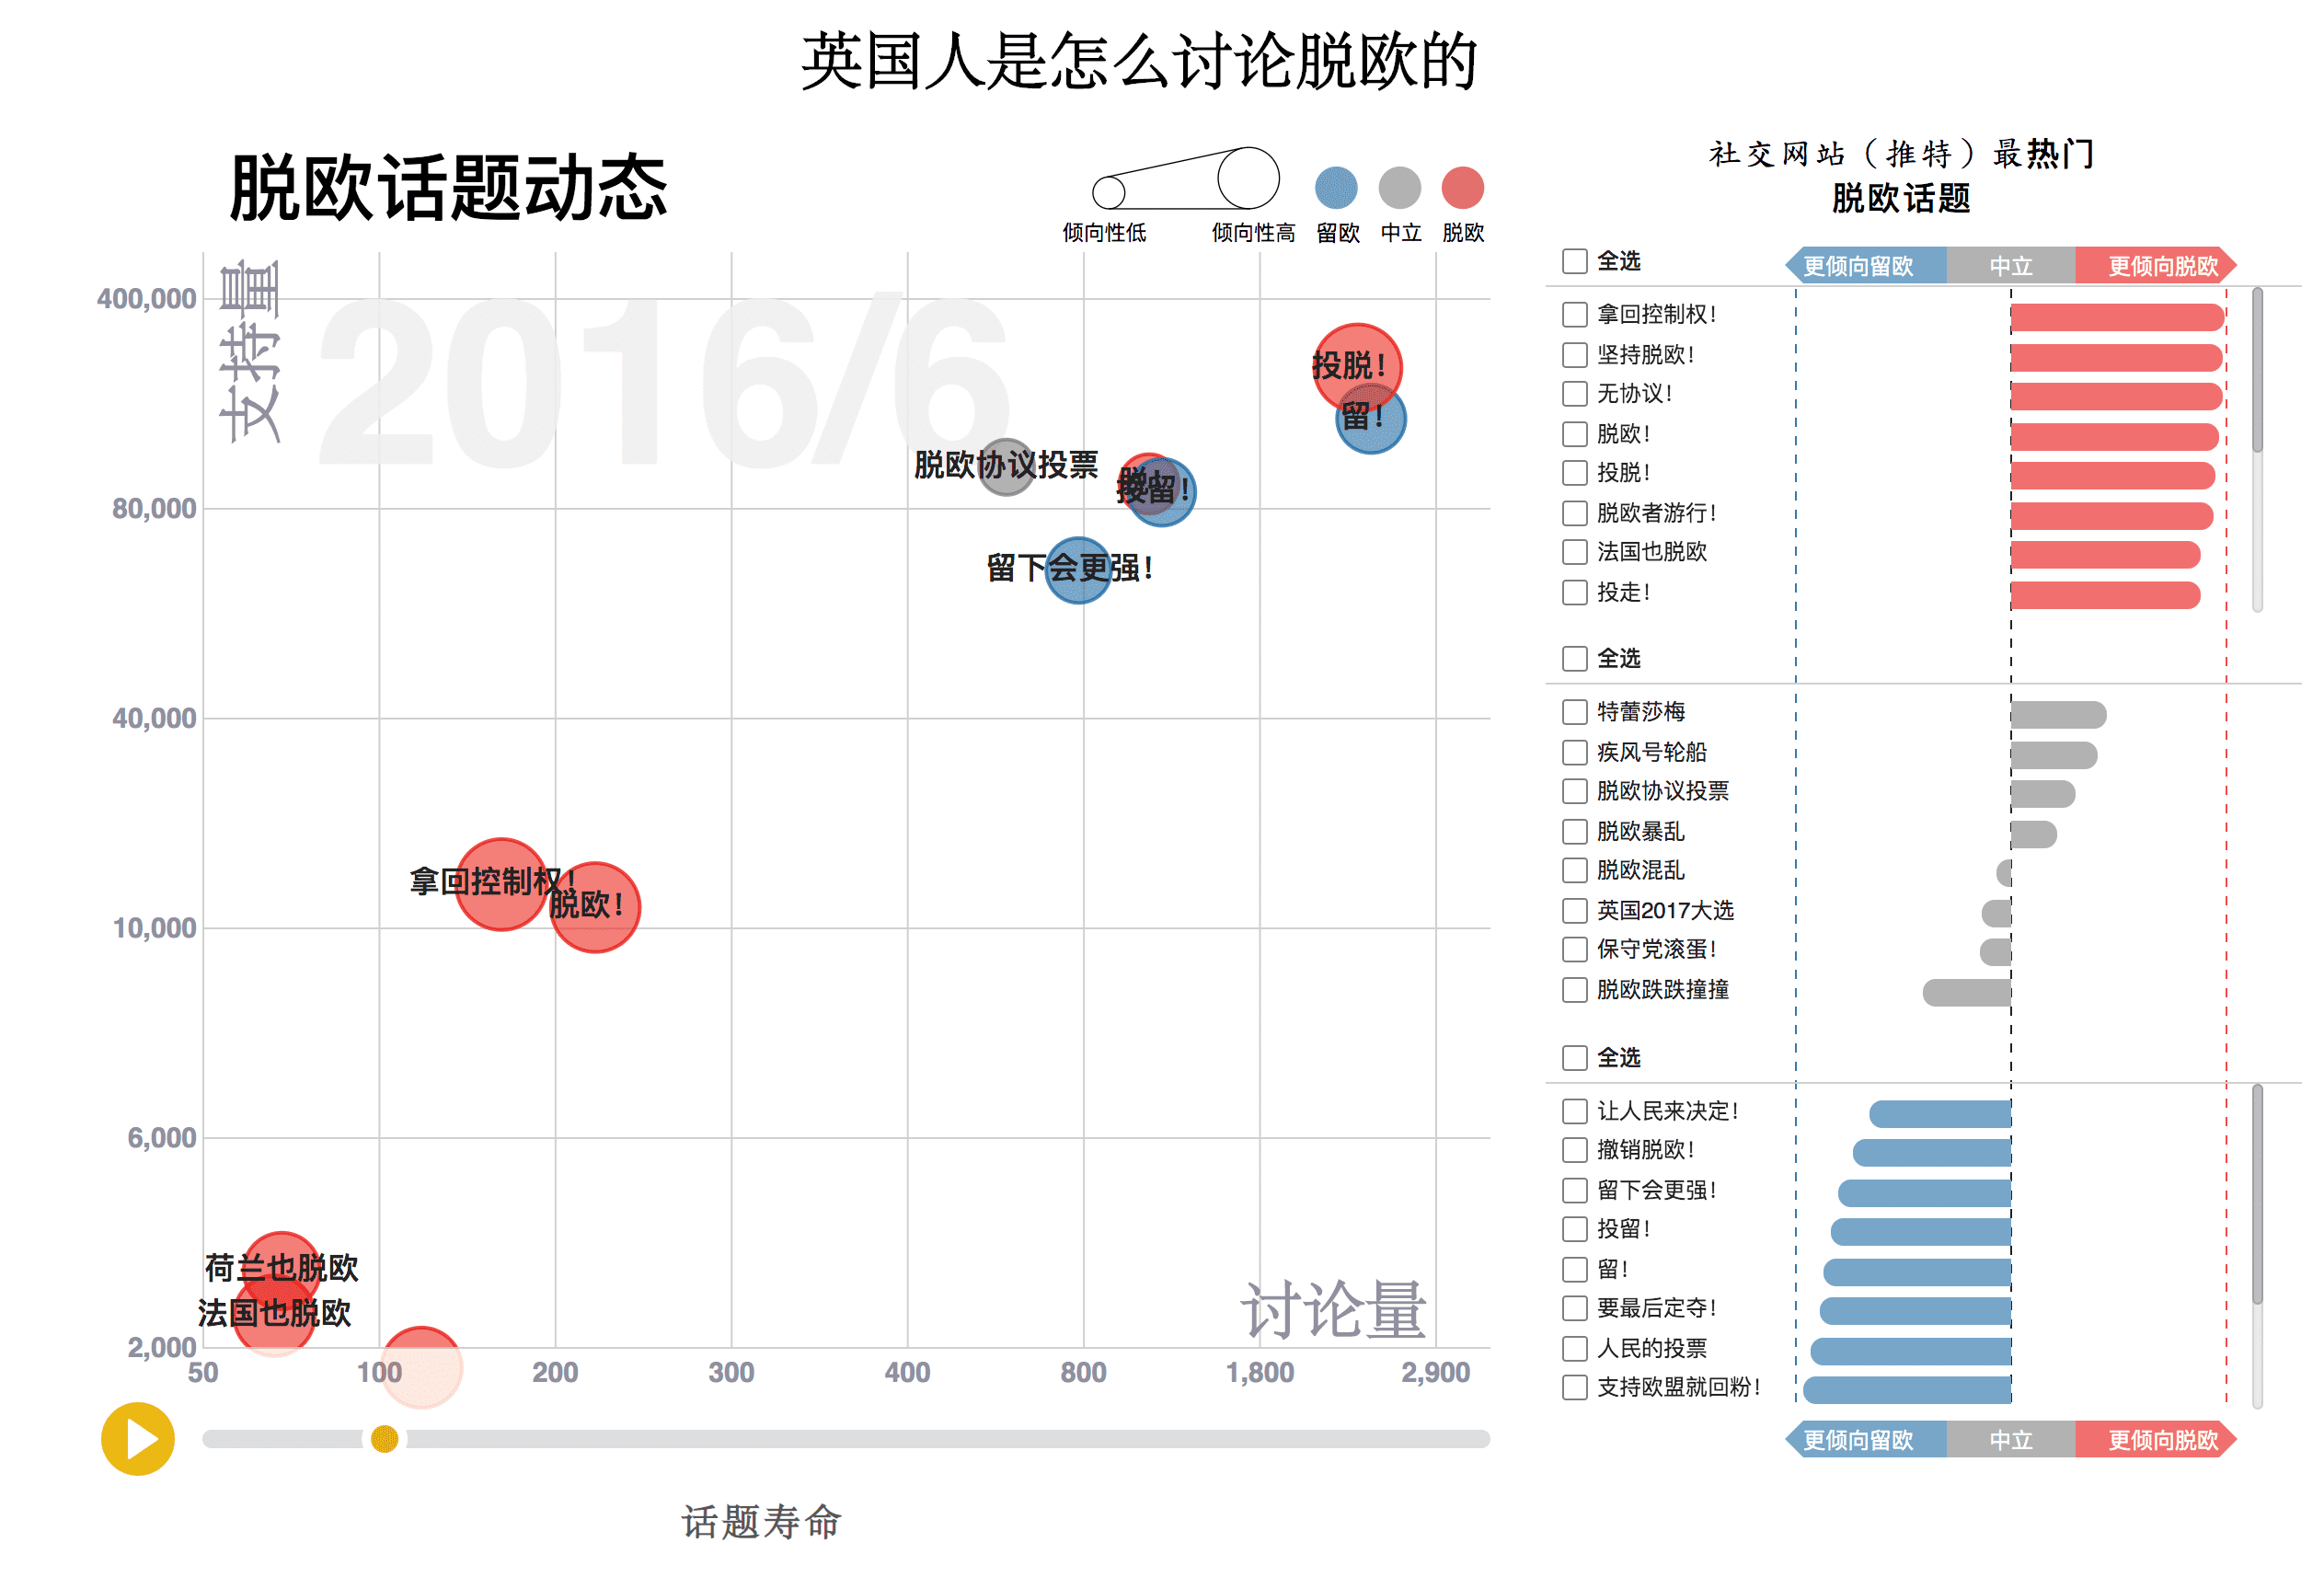
How Do the British Discuss Brexit
An animated bubble chart is developed to visualize the dynamic of
twitter hashtags related to Brexit topics from 2016 to 2019. This
project is part of Brexit visualization story project collaborated
with China Central Television Europe.